LaTeX에서 2x2 배열의 그림 넣기 코드
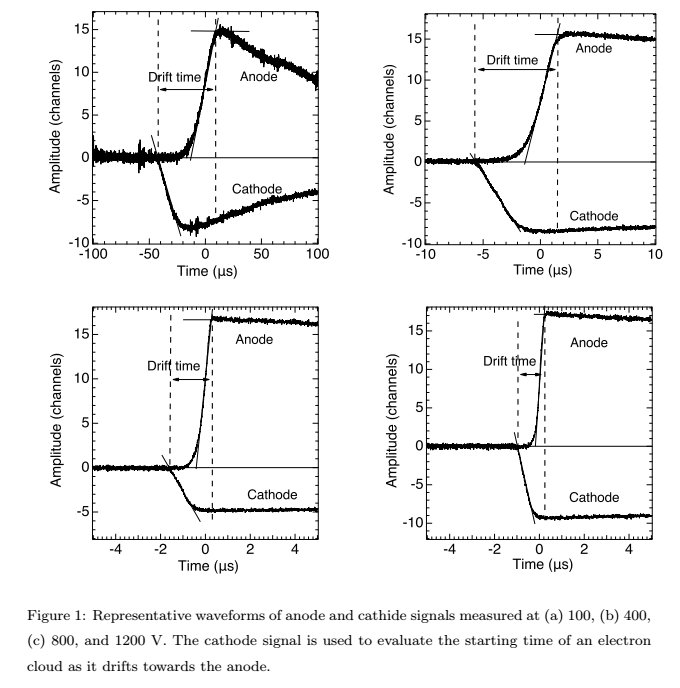
LaTeX에서 2x2 배열의 그림 넣기 코드 (그림 4개, 캡션이 1개인 경우)
\begin{figure}
\centering \
label{tofsignal}
\begin{tabular}{cc}
\includegraphics[width=0.5\textwidth ]{Fig02-0.eps}& \includegraphics[width=0.5\textwidth ]{Fig02-1.eps}\\ \includegraphics[width=0.5\textwidth ]{Fig02-2.eps}& \includegraphics[width=0.5\textwidth ]{Fig02-3.eps}\\
\end{tabular}
\caption{Representative waveforms of anode and cathide signals measured at (a) 100, (b) 400, (c) 800, and 1200 V. The cathode signal is used to evaluate the starting time of an electron cloud as it drifts towards the anode.}
\end{figure}
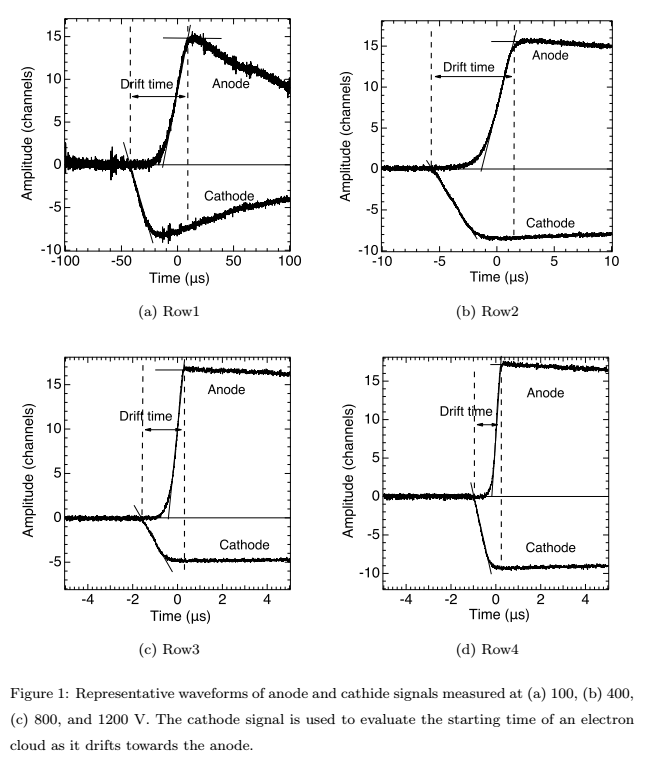
LaTeX에서 2x2 배열의 그림 넣기 코드 (그림 4개에 각각의 캡션, 그리고 전체 캡션이 필요한 경우)
\usepackage{subfig} 추가
\begin{figure}%
\subfloat[Row1]{{\includegraphics[width=0.5\textwidth ]{Fig02-0.eps} }}%
\subfloat[Row2]{{\includegraphics[width=0.5\textwidth ]{Fig02-1.eps} }}%
\hfill
\subfloat[Row3]{{\includegraphics[width=0.5\textwidth ]{Fig02-2.eps} }}%
\subfloat[Row4]{{\includegraphics[width=0.5\textwidth ]{Fig02-3.eps} }}%
\caption{Representative waveforms of anode and cathide signals measured at (a) 100, (b) 400, (c) 800, and 1200 V. The cathode signal is used to evaluate the starting time of an electron cloud as it drifts towards the anode.}%
\label{tofsignal}%
\end{figure}